November 6: the Nasdaq’s worst day since April 2025, and bitcoin’s largest drop since June
A selloff in AI and chip stocks after the midterm results took the Nasdaq down 5.52%, and bitcoin fell 5.55% to close back on the daily support at $75.2k. What happened, where price sits now, the levels either side, and a new 7-day call.
- Price
- $75,814 −6.5% vs band top
- MVRV Z
- 0.71 Fair · 0 to 2
- 200W MA
- $67.6k price 1.12× above
- Cycle clock
- 89 d left in low window
01What happened yesterday
US stocks had their worst day in 19 months on Thursday. The Nasdaq Composite closed down 5.52% and the S&P 500 down 4.36%, both their worst sessions since April 4, 2025, and the Dow fell 1,833 points, or 3.44% (closing figures from Fox Business; CNBC gives the same “worst since” dates). Reports put the cause in AI and chip stocks: investors weighed what the Democrats’ midterm gains could mean for data-centre building. Wednesday’s rally in stocks after the results was undone, and so was bitcoin’s 3.99% gain the same day.
Bitcoin moved with the open. It was $79,411 at the 14:30 UTC opening bell and $75,463 at 15:50: down 5.0% in 80 minutes. It spent the evening between $75.5k and $76.9k, dipped to $75,088 at 23:10, the lowest since September 16, and closed the day at $75,971, down 5.55%. That is the largest daily drop since June 2 and the lowest close since September 15. Bitcoin’s UTC day and the Nasdaq’s session are not the same window, so the near-equal percentages say less than they seem.
Hourly candles, Bitstamp BTC/USD, UTC; the last candle is still open. Shaded: Thursday’s range. Marked: the 14:00 UTC candle, in which US stocks opened at 14:30. Lines: the daily resistance at $81.2k, the 4-hour level at $79.2k, hourly resistance at $77.5k and $76.2k, and the daily support at $75.2k.
02Where price sits, and the scoring
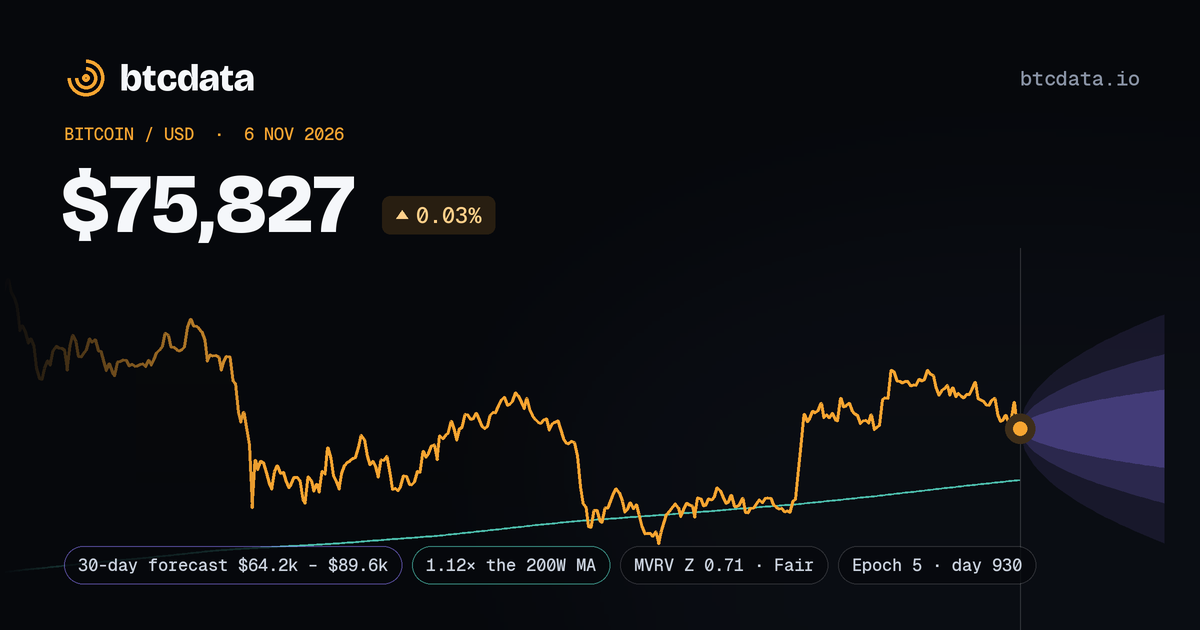
Bitcoin is $75,814 at 09:06 UTC, down 4.34% in 24 hours and 4.8% below the last note’s $79,602. Overnight it held a narrow range; this morning’s low was $75,205 at 07:30. It is back inside the accumulate band, 6.5% under its top edge at $81.1k. MVRV Z is 0.71, from 0.86. Funding fell from the 0.01% default to 0.0016% per 8 hours; open interest on the three venues the site tracks is 198,992 BTC, little changed. DVOL rose from 37.0 to 40.9, and 30-day realized volatility to 36.5%.
Scoring: issue 2’s 7-day call, $75,090 to $85,203, resolved at Thursday’s close, $75,971: a hit, 1.2% above its floor. Issue 7’s 24-hour range, $78.4k to $82.2k, resolves at 11:00 today with price 3.3% under its floor: unless price recovers by then, a miss. The other open 7-day calls are inside: issue 3’s resolves at tonight’s close, 4.0% above its floor, and issue 7’s floor, $74,893, is now 1.2% below. Both 30-day calls are inside.
03The levels either side
Price is inside the daily support zone at $75.2k ($74.1k to $76.2k, September’s lows, on the default 1-year view) and the 4-hour level at $75.9k. Within it, an hourly support at $75.4k ($75.09k to $75.62k) has turned price three times since Wednesday, at $75,618, $75,463 and $75,088.
Above, hourly resistance sits at $76.2k, $77.5k and $78.0k, then the 4-hour levels at $79.2k and $80.8k, and the daily resistance at $81.2k ($79.5k to $82.8k). Below the daily zone, the next levels are the daily support at $71.5k ($70.6k to $72.3k) and the long-term weekly zone, $69.0k to $74.7k, shown as $71.8k; past them, daily support at $65.1k. In walk-forward tests, daily levels have held a little more often than random prices; hourly and 4-hour levels have not.
Chance of trading at each level at any point in the next 7 days, from the scored cone. Levels at issue: $76.2k, $77.5k, $78.0k and $75.4k from hourly bars, $79.2k from 4-hour bars, $81.2k and $71.5k from daily bars, and $84.9k and $71.8k from the long-term weekly set.
Thursday’s fall stopped where Wednesday’s dip did: inside the daily support at $75.2k, September’s lows.
04What the cone allows, and the call
The forecast issued at 07:00 UTC gives a 24-hour 80% range of $73.2k to $77.5k, a 7-day range of $69.4k to $81.7k and a 30-day range of $63.4k to $89.4k. Over 30 days it gives $70k a 58% chance of trading and $90k 18%, against 24% and 33% yesterday: the drop moved the centre of the cone, and higher volatility widened it.
Forecast issued 07:00 UTC on November 6, from a spot of $75,317. No direction is assumed: the median is the spot.
This issue’s call: the forecast’s 80% range for November 13 is $69,394 to $81,747, and its 95% range is $66,253 to $85,621. The November 13 close scores it.
None of this is a trade signal. It describes where price sits and the range the models allow.
The forecast’s ranges at issue, stored with the note. The Friday, November 13, 2026 close scores it in 7 days; the result shows here and on the notes page.
A reading of public data on the issue day, not a forecast of direction or investment advice.