November 2026: October fell 7.3%, its weakest since 2014, and price is back inside the accumulate band
Bitcoin held just above the accumulate band for most of October, then the Binance hack pushed it back inside. How the month closed, where price sits now, the levels for November and the range the models allow to December 2.
- Price
- $77,388 −4.3% vs band top
- MVRV Z
- 0.78 Fair · 0 to 2
- 200W MA
- $67.4k price 1.15× above
- Cycle clock
- 90 d left in low window
01How October closed
Bitcoin closed October at $77,430 on Bitstamp, down 7.3% from September’s $83,563 close. That is the weakest October since 2014, which fell 13.6%, and the second red October in a row after 2025’s 4.0% drop. The last back-to-back pair was 2011 and 2012. The month’s high, $87,219, came on October 2 and the low, $76,173, on October 30. 14 of its 31 days closed higher.
Daily candles, Bitstamp BTC/USD, UTC; the last candle is November 2, still open. Amber: the accumulate band's top edge at the November 1 close (it rose from $79.1k to $80.9k during October). Lines: the daily resistance at $87.9k and support at $75.2k.
From September 18 to October 24, every close held above the accumulate band’s top edge. The edge gave way on October 29, the day of the Binance hack: a 4.25% drop, October’s largest, to the lowest close since September 17. Price has closed inside the band every day since.
Scoring: October’s 30-day call, issued October 1 at $84,777, resolved at $77,401 on the site’s daily series, inside its 80% range of $72.4k to $99.2k. Of the last twelve monthly calls, nine landed inside the 80% range, two only inside the 95%, and one, August, outside both. Issue 1’s 30-day call (to November 23) and the three 7-day calls from issues 2 to 4 (November 5 to 7) were all inside their ranges at the November 1 close.
02Where price sits
Bitcoin is $77,388 at 16:41 UTC on November 2, down 0.9% in 24 hours. That is inside the accumulate band, which runs from realized price ($54.0k) to the top edge ($80.9k), and 4.3% under that edge. Since 2012 price has closed at or under the edge on 21% of days, and the median return a year later has been +122%, positive every time. Those are a few overlapping cycles, not a large sample.
Accumulate band: realized price to the pipeline's upper edge, as of the November 1 close. Year range: 2026's lowest and highest daily closes on the site's series.
MVRV Z reads 0.78, Fair, down from 1.02 on October 1. It has been higher on 79% of days this epoch, but it is still well above the sub-zero readings that marked past cycle lows. The epoch’s low reading, 0.18, came on June 30.
The cycle-low window, 450 to 600 days before the halving, has 90 days left on the site’s clock, up from 75 in the last note. The clock moved because the halving estimate moved to April 25, 2028: this difficulty period’s blocks have averaged 616 seconds. At the 600-second target the window would close on January 17 instead, 76 days out. Either way the year’s lowest close, on June 30, came before the window opened.
The window is timing context, never a level.
03The levels for November
Above, the chart’s daily levels show resistance at $79.4k to $81.5k, where price closed every day from October 22 to 28. Then come $82.3k to $84.8k, and October’s high zone at $86.9k to $89.2k. The weekly set has a broad zone from $80.5k to $89.2k, so every price up to $89k is inside a resistance zone on at least one timeframe.
Below, the hourly support at $76.3k ($75.95k to $76.5k) held twice on October 30. Under it is the daily zone at $74.1k to $76.2k, September’s lows. Next is the weekly zone from $69.0k to $74.7k, centred on $71.8k. Further down, the daily level at $67.1k ($66.3k to $67.9k) now contains the 200-week moving average, $67.4k.
In the site’s walk-forward test since 2012, the nearest daily levels held on about 60% of retests, against 54% for random prices at similar distances. They are places where moves have tended to pause, not floors or ceilings.
Chance of trading at each level at any point in the next 30 days, from the scored cone. $90k and $60k from the forecast; the rest from the same volatility. Levels: $87.9k, $83.4k, $80.3k, $75.2k and $67.1k from daily bars over one year, $71.8k from the long-term weekly set.
04What the cone allows
30-day realized volatility is 28.7%, lower than on 91% of days in five years, even with the hack. The ensemble reads 40.5% for the month ahead, between EWMA at 30.3% and GARCH at 52.2%. Options imply about the same: DVOL is 39.8. That gives a 30-day 80% range of $66.6k to $89.7k, about −14% to +16%.
Forecast issued 16:00 UTC on November 2, from a spot of $77,317. No direction is assumed: the median is the spot.
The 30-day ranges are the site’s weak spot. Since May 6 they have held 64% of the time on an 80% promise; over the long-run backtest since 2015, 78%.
Past days with MVRV Z within 0.25 and a 200-week multiple within 0.15 of the November 1 readings, from the 2020 and 2024 epochs. Bar: the middle 80% of outcomes. Dot: the median.
That is a turn from October’s issue, when the 30-day median was positive. 127 of the days in each row come from 2020, so this is mostly one cycle’s memory. Seasonality is thinner still: 9 of 15 Novembers on Bitstamp rose, median +8.8%, but they range from −37.0% in 2018 to +450% in 2013, and last November fell 17.5%.
05The call
This issue’s call: the forecast’s 80% range for December 2 is $66,609 to $89,747, and its 95% range is $61,467 to $97,255. The December 2 close scores it, here and on the notes page.
None of this is a trade signal. It describes where price sits and the range the models allow.
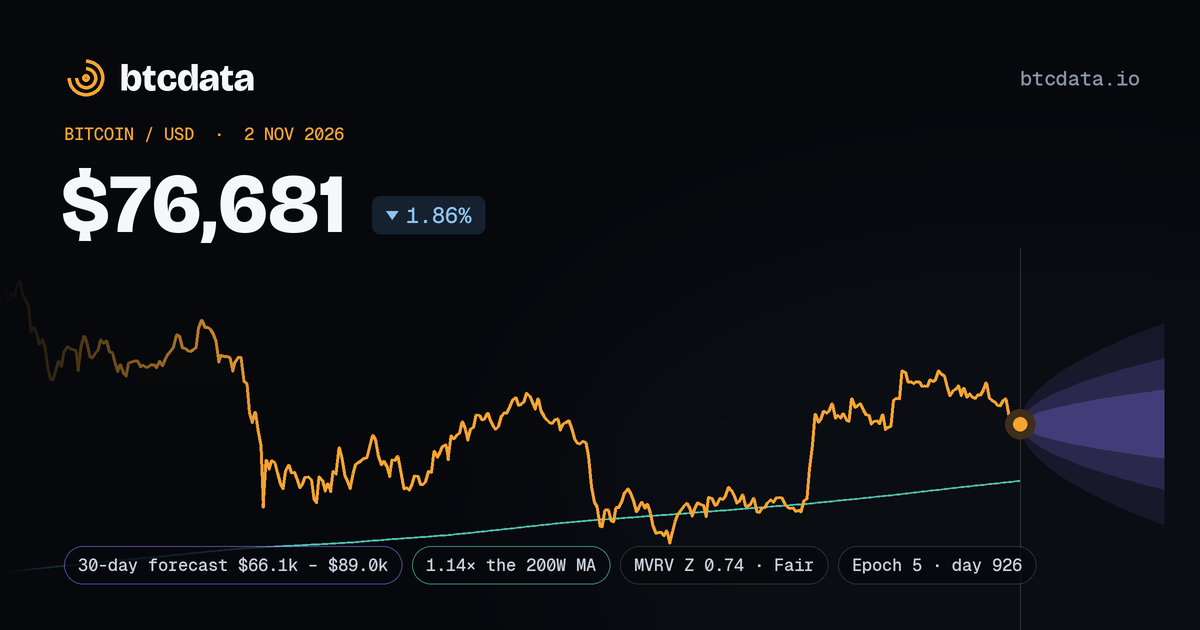
The forecast’s ranges at issue, stored with the note. The Wednesday, December 2, 2026 close scores it in 30 days; the result shows here and on the notes page.
A reading of public data on the issue day, not a forecast of direction or investment advice.