October 30: a Binance hack takes bitcoin 6.8% off its high, into September’s support
Reports of a multi-billion-dollar Binance hack broke late on October 29, and bitcoin fell from $81.9k to $76.3k by 02:05 UTC, out of the week’s box. Where it landed, the levels either side, what the cones allow now, and a new 7-day call.
- Price
- $77,891 −3.5% vs band top
- MVRV Z
- 0.78 Fair · 0 to 2
- 200W MA
- $67.3k price 1.16× above
- Cycle clock
- 76 d left in low window
01What happened overnight
Price was already sliding before the news: from the day’s high of $81,888 at 16:05 UTC it had eased 1.9% to $80,302 by 20:20. At 20:24, on-chain trackers saw the first large transfer out of a Binance hot wallet, about $2.8 billion in ether and tokens. By 20:45 bitcoin was at $78,200, down 2.6% in 25 minutes.
A bounce to $79,546 at 21:35 did not last. Shortly after midnight Binance suspended deposits and withdrawals and its co-founder Yi He said the exchange would cover all losses. Price kept falling to $76,320 at 02:05, when the night’s selling stopped. At 02:30 Binance put the damage at about $6.3 billion, with about $3 billion frozen. Those figures are the exchange’s and trackers’ early estimates, as reported, and may change.
Daily candles, Bitstamp BTC/USD, UTC days; October 30 is the issue day, still open. Shaded: last week's range, October 23 to 28. Lines: the accumulate band's top edge, the hourly levels either side of price, and the daily support zone's centre.
Leverage took the brunt. CoinGlass counted $1.55 billion of liquidations in 24 hours, $1.34 billion of them longs. Funding stayed positive on all three venues the site tracks, 0.0037% per 8 hours on average, a little below the week’s 0.0048%. Longs were cut, but shorts have not piled in.
02Where price landed
The October 29 close, $77,793, was the lowest since September 17, and the overnight low the lowest since September 18. Last week’s box, $79.1k to $81.9k, is broken: the last note named a daily close outside it as the first thing that would change the read.
The low landed inside the daily support zone that note listed, $74.7k to $76.5k, the September 15 and 16 lows where the last rally began. Price is back inside the accumulate band, 3.5% below its top edge of $80.7k and 1.16× the 200-week moving average of $67.3k. MVRV Z is 0.78, still in the Fair range.
03The levels either side
The nearest level above is on 5-minute bars: $78.6k, 0.9% up, where this morning’s bounce stalled at $78,644. The hourly chart has resistance at $79.0k (a zone from $78.5k to $79.3k), right under the old box floor, then $79.6k. On daily bars the whole old box, $79.7k to $82.6k, is now one resistance zone centred at $81.3k. Below, hourly support sits at $77.6k, 0.4% under price, and at $76.3k, the zone the overnight low made ($76.0k to $76.5k). Then the daily zone at $75.6k, and the long-term weekly support at $71.8k (a zone from $69.0k to $74.7k).
Chance of trading at each level at any point in the next 7 days, from the scored cone. Levels from the chart's support and resistance layer at issue: $78.6k from 5-minute bars, $79.6k, $79.0k, $77.6k and $76.3k from hourly bars, $81.3k and $75.6k from daily bars, $71.8k from the long-term weekly set.
A daily close back above $79.1k would put price back in the old box; one below $74.7k would leave September’s support behind.
04What the cone allows
The night woke volatility up, but only a little. 30-day realized volatility is 28.5%, still lower than on 92% of days in the last five years, and the options market’s DVOL reads 37.3, up from 36.0 yesterday and near the bottom of its one-year range.
The ensemble reads 40.2% for the month ahead, between EWMA at 31.7% and GARCH at 52.3%. That gives a 24-hour 80% range of $76.1k to $79.8k and a 7-day range of $72.8k to $83.4k.
Forecast issued 08:00 UTC on October 30, from a spot of $77,924. No direction is assumed: the median is the spot.
Scoring yesterday: issue 2’s 24-hour 80% range was $78.3k to $81.7k. With half an hour left, price is 0.5% below it, and the overnight low went under its 95% floor of $77.2k too. Unless the next 30 minutes bring that 0.5% back, it is a miss. Its 7-day call, $75.1k to $85.2k, still holds; the low stayed $1.2k above its floor, and the November 5 close scores it.
05The call
The forecast’s 80% range for November 6 is $72,815 to $83,391, and its 95% range is $70,083 to $86,642. The November 6 close scores it, here and on the notes page.
None of this is a trade signal. It describes where price sits and the range the models allow.
Correction, October 31: the cycle clock at issue read 39 days until the low window. That day’s halving estimate used an unusually slow average block time; on a normal estimate the window is open, with 76 days left. Nothing else in this note used it.
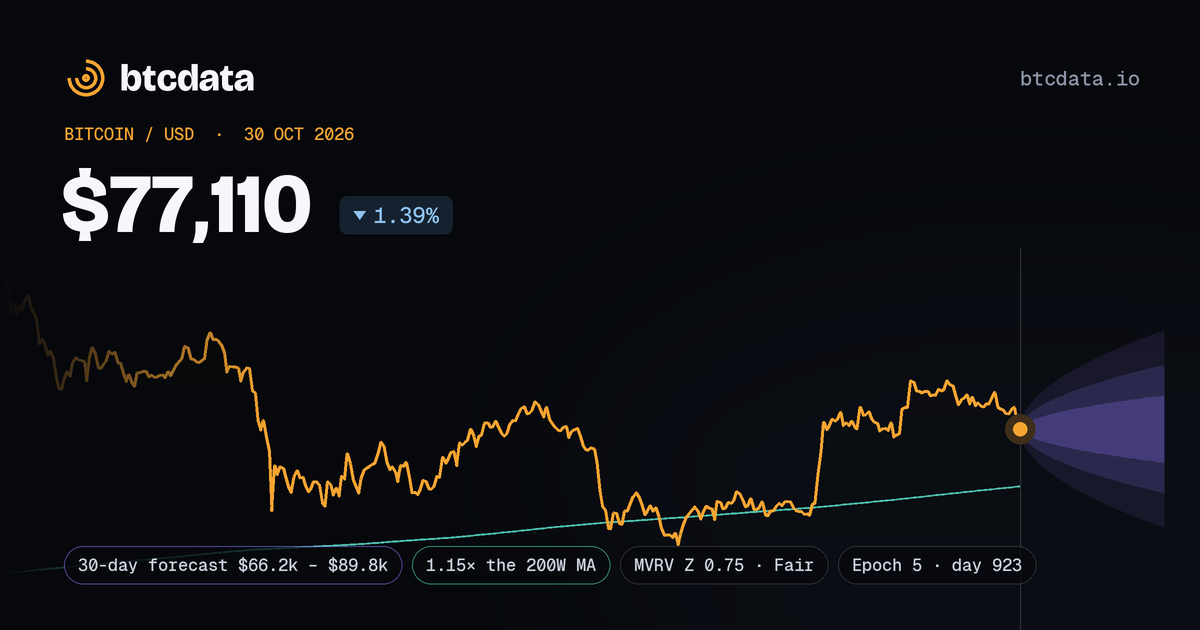
The forecast’s ranges at issue, stored with the note. The Friday, November 6, 2026 close scores it in 7 days; the result shows here and on the notes page.
A reading of public data on the issue day, not a forecast of direction or investment advice.