October 2026: on the band’s top edge, in the quietest market in years
Price has closed just above the accumulate band all month, realized volatility is near a five-year low, and the cycle-low window has 62 days to run. What the numbers say, and what they do not.
- Price
- $80,739 +0.4% vs band top
- MVRV Z
- 0.87 Fair · 0 to 2
- 200W MA
- $67.0k price 1.21× above
- Cycle clock
- 62 d left in low window
01Where price sits
Bitcoin was $80,739 at issue, down 4.8% on the month and 27% below where it stood a year ago. Every October close has landed between $80,924 and $86,521: just above the accumulate band, which runs from realized price ($54.1k) to 1.2× the 200-week moving average ($80.4k).
Accumulate band: realized price to 1.2× the 200-week MA, as of the October 23 close.
Price spent 144 days inside the band this year, from February 5 to September 17. Since 2012 it has closed at or under that top edge on 21% of days, and a year later the median return from those days was +122%, positive every time. That is a handful of overlapping cycles, not a sample: it says where price sits, not where it goes.
MVRV Z-score since the April 2024 halving, monthly, with the epoch's high and low.
MVRV Z reads 0.87, down from 1.02 on October 1 and 1.97 a year ago. Price is closer to holders’ cost basis than on three quarters of the days this epoch, but nowhere near the sub-zero readings that have marked every past cycle low. The epoch’s low reading, 0.18, came on June 30, the same day as the year’s lowest close.
02The clock
The next halving is estimated for March 19, 2028, 512 days away. Three of the four past cycle lows printed 450 to 600 days before their halving. For this cycle that window runs from July 28 to December 25, 2026.
Days before each halving that its cycle's low printed. 2011's low came 376 days out, outside the window.
The lowest close inside the window so far is $62,752 on August 1. The year’s low, $58,525 on June 30, came four weeks before the window opened. With 62 days left, the window cannot say whether the low is already in.
The window is timing context, never a level.
03What the cone says
The market is unusually calm. The largest daily move this month was a 3.5% drop on October 22.
The three forecast models disagree about how long that lasts. EWMA, which weights recent days most, reads 31% annualised; GARCH reads 52%, because it expects volatility to revert towards its long-run 55% within weeks. The ensemble sits between, at 40%, so the cone is wider than the last month alone would suggest. No direction is assumed: the median is today’s price.
Chance of trading at each level at any point in the next 30 days, from the forecast's volatility.
With price 0.7% over the band’s top edge at the last close, the cone puts the odds of trading back inside within 30 days at 89%.
Past days with MVRV Z within 0.25 and a 200-week multiple within 0.15 of today's, almost all in the 2020 and 2024 epochs. Bar: the middle 80% of outcomes. Dot: the median.
The 180-day row is the one that stands out: 93% higher, median +44%. It also leans on one epoch: 89 of its 110 days come from 2020, so read it as one cycle’s memory rather than a base rate.
04How the forecasts have scored
Since April 27, 505 forecasts have been scored. Price landed inside the 80% range 79% of the time. The 24-hour and 7-day ranges are on target; the 30-day range is not, at 62% inside on an 80% promise.
The miss was August: issued at $62,752, the month closed at $78,534, up 25% and above even the 95% range. September’s call landed inside the 80% range. Every result is on the track record under the chart.
05What changed on the site
- The layer rail: every chart layer, grouped by what it tells you, down the chart’s left edge.
- Snapshot links: share any day as
btcdata.io/s/<day>, with that day’s card as the preview on X and Reddit, or save the chart as an image. - These notes: one a month, written from the same numbers the chart shows, and scored like everything else here.
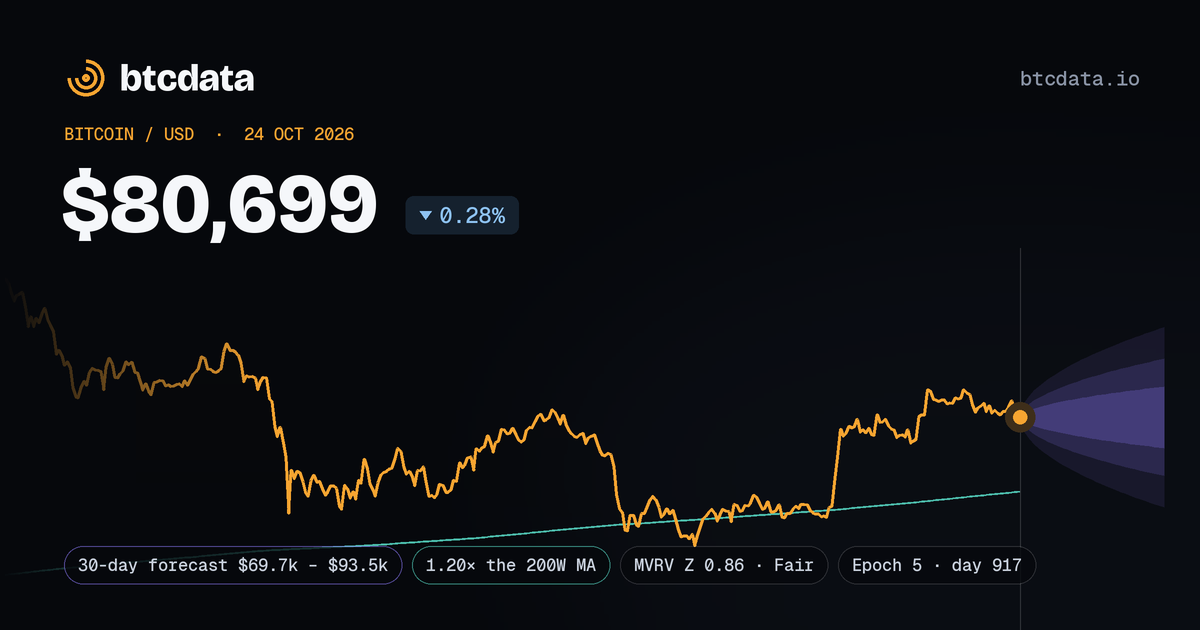
The forecast’s ranges at issue, stored with the note. The Monday, November 23, 2026 close scores it in 30 days; the result shows here and on the notes page.
A reading of public data on the issue day, not a forecast of direction or investment advice.