November 5: from $75.6k to $81.1k in twelve hours, the largest daily gain since September 21
Bitcoin dipped to its lowest since September 16 early on Wednesday, then rose 7.3% in about twelve hours and closed up 3.99%. Where it sits now, the levels either side on each timeframe, and a new 7-day call.
- Price
- $79,602 −1.8% vs band top
- MVRV Z
- 0.86 Fair · 0 to 2
- 200W MA
- $67.5k price 1.18× above
- Cycle clock
- 89 d left in low window
01What changed since the last note
Bitcoin is $79,602 at 12:49 UTC, 3.2% above the last note’s $77,138 and up 1.01% in 24 hours. Tuesday, November 3, closed at $77,345, up 0.88%. Early on Wednesday, price dipped through the hourly support at $76.3k, its fourth test since the Binance hack, and touched $75,618 at 03:05, the lowest since September 16. No hourly close went under that support’s lower edge, $75.95k. Price climbed through the morning, then ran from $78,269 at 14:00 to $81,105 at 15:15, 3.6% in 75 minutes. Wednesday closed at $80,434, up 3.99%: the largest daily gain since September 21 and the highest close since October 28. Today held between $80.1k and $80.8k until noon, then slipped to $79,535 in the 12:00 hour.
Scoring: issue 5’s 24-hour range, $75.6k to $79.1k, resolved at 16:00 on November 3 at $77,576, and issue 6’s, $75.1k to $78.7k, resolved at 10:00 yesterday at $78,274: two hits. All four open 7-day calls are inside. Issue 2’s, $75,090 to $85,203, resolves at tonight’s close; price is 5.7% above its floor and 7.0% under its ceiling. Wednesday’s low came within 0.7% of that floor, but calls are scored on the close. The nearest edge now is issue 6’s ceiling, $82,257, 3.3% above. Both 30-day calls are inside.
02Where price sits
Price is inside the accumulate band, 1.75% under its top edge at $81.0k. Wednesday’s high went just over that edge and the day closed back under it. MVRV Z is 0.86, up from 0.74 on November 3. Perpetual funding is at the 0.01% default per 8 hours, and open interest on the three venues the site tracks is 198,095 BTC, down 2.7% since November 3, so the rise came without added leverage there. 30-day realized volatility is 31.5%; DVOL is 37.0, in the lowest fifth of the past year.
Hourly candles, Bitstamp BTC/USD, UTC; the last candle is still open. Shaded: Wednesday’s range. Lines: the daily resistance at $81.2k, the 4-hour level at $79.2k that price sits in, hourly support at $78.7k and $77.5k, and the daily support at $75.2k.
03The levels either side
Price sits in two zones at once: a 4-hour level at $79.2k ($78.75k to $79.69k), and the bottom of the daily resistance zone at $81.2k ($79.5k to $82.8k, on the chart’s default 1-year view).
Above, 5-minute levels from this morning’s range sit at $80.0k, $80.2k and $80.3k. Then come the 4-hour resistance at $80.8k ($80.3k to $81.2k), where today’s high of $80,822 stopped, and Wednesday’s high on hourly bars at $81.0k. Higher up, 4-hour resistance sits at $81.9k and $83.1k, and the long-term weekly zone runs from $80.5k to $89.2k; the levels panel shows it as $84.9k.
Below, hourly support sits at $78.7k ($78.53k to $78.87k), $78.0k and $77.5k. Then come the 4-hour support at $75.9k and the daily support at $75.2k ($74.1k to $76.2k, September’s lows), where Wednesday turned. Under that is the weekly support at $71.8k ($69.0k to $74.7k). In walk-forward tests, daily levels have held a little more often than random prices; hourly and 4-hour levels have not.
Chance of trading at each level at any point in the next 7 days, from the scored cone. Levels at issue: $80.8k from 4-hour bars, $78.7k, $78.0k and $77.5k from hourly bars, $81.2k and $75.2k from daily bars, $83.1k from 4-hour bars, and $84.9k and $71.8k from the long-term weekly set.
Wednesday’s low turned inside the daily support; this morning’s high stopped inside the 4-hour resistance.
04What the cone allows, and the call
The forecast issued at 11:00 UTC, before the 12:00 dip, gives a 24-hour 80% range of $78.4k to $82.2k, a 7-day range of $74.9k to $86.0k and a 30-day range of $69.0k to $93.3k. Over 30 days it gives $90k a 33% chance of trading and $70k 24%, against 17% and 42% in issue 6.
Forecast issued 11:00 UTC on November 5, from a spot of $80,256. No direction is assumed: the median is the spot.
This issue’s call: the forecast’s 80% range for November 12 is $74,893 to $86,003, and its 95% range is $72,024 to $89,429. The November 12 close scores it.
None of this is a trade signal. It describes where price sits and the range the models allow.
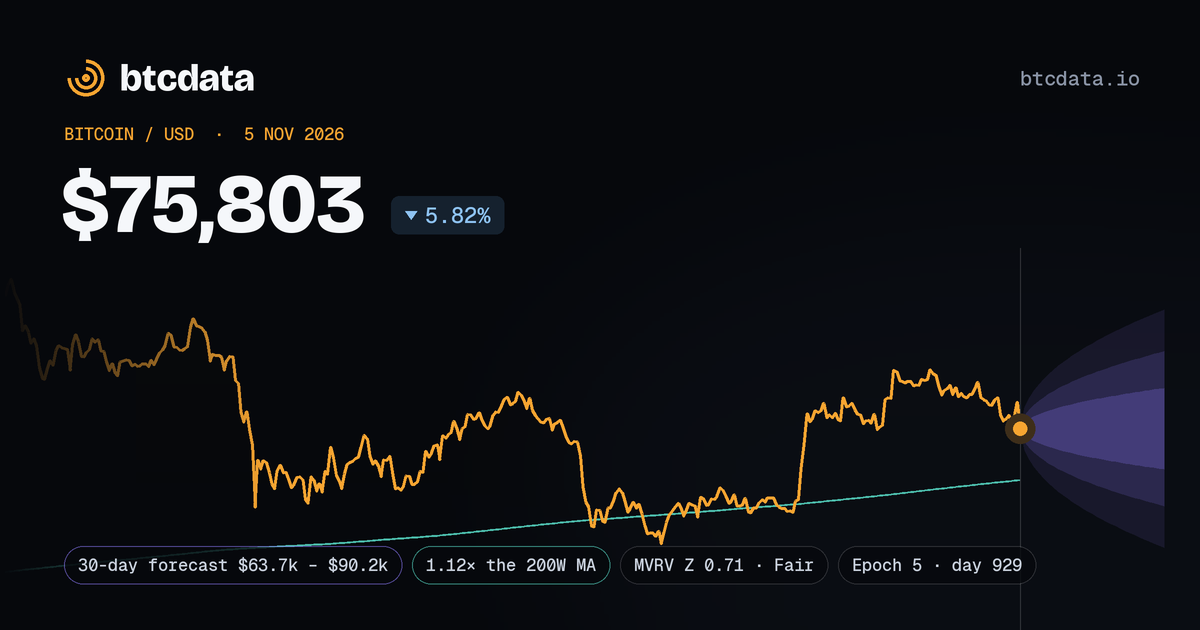
The forecast’s ranges at issue, stored with the note. The Thursday, November 12, 2026 close scores it in 7 days; the result shows here and on the notes page.
A reading of public data on the issue day, not a forecast of direction or investment advice.