October 29: a week in a 3.5% box, astride the band’s top edge
Since the October 22 drop, bitcoin has traded between $79.1k and $81.9k, back and forth across the accumulate band’s top edge. A short-term read: the levels either side, what the 24-hour and 7-day cones allow, and one 7-day call.
- Price
- $80,165 −0.7% vs band top
- MVRV Z
- 0.88 Fair · 0 to 2
- 200W MA
- $67.2k price 1.19× above
- Cycle clock
- 53 d left in low window
01A week in a box
The October 22 session took price from $84.0k to $81.3k, the month’s largest daily drop. Since then every daily close has landed between $80,006 and $81,315, and the whole week’s trading has stayed between $79,146 and $81,941. Today’s low, $79,607, came within 0.6% of the box floor.
Daily candles, 4-exchange average, UTC days; October 29 is the issue day, still open. Shaded: the range since October 23. Lines: the accumulate band's top edge, the nearest support, the daily levels either side of the box, and the long-term resistance above. The nearest resistance, $80.3k, sits between the band edge and the support and is left off for room.
The box sits across the accumulate band’s top edge: 1.2× the 200-week moving average, now $80.7k and rising about $55 a day. The last note put the odds of trading back inside the band within 30 days at 89%; it took two days. Since then price has closed on both sides of it, and is 0.7% inside at issue. For now the edge works as a pivot, not a floor.
02The levels either side
The chart’s support and resistance layer finds two levels inside the box. Resistance at $80.3k, 0.2% above, has held 4 of its 7 tests. Support at $79.6k, 0.7% below, has held both of its tests, the second one this morning. With both this close, the cone puts near-certain odds on touching each within a week, and the resistance first 77% of the time. That mostly reflects which one is nearer.
Chance of trading at each level at any point in the next 7 days, from the scored cone. Levels from the chart's support and resistance layer at issue: $80.3k and $79.6k from 5-minute bars, $82.4k and $75.6k from daily bars, $84.9k and $71.8k from the long-term weekly set.
Past the box, the daily chart has a level on each side. Above, $82.4k (a zone from $81.5k to $83.4k) overlaps the top of the box; price has closed through it four times since late September, so it is a weak ceiling, with a 57% chance of trading this week. Below, $75.6k (a zone from $74.7k to $76.5k) is the September 15 and 16 lows, where the rally to $81k began two days later: 5.7% down, at 23%.
Further out are the long-term weekly levels: $84.9k, where the October 21 rally stalled at $84.8k, 5.9% up at 24%, and $71.8k, 10.4% down at 3%.
A daily close outside $79.1k to $81.9k is the first thing that would change this read.
03What the cone allows
The market is still very quiet. 30-day realized volatility is 25.9%, lower than on 96% of days in the last five years, and the options market’s DVOL reads 36.0, near the bottom of its one-year range of 33.6 to 82.6.
The forecast does not assume the calm lasts. GARCH reads 51% for the month ahead because it expects volatility to revert towards its 56% long-run level, with a half-life of about a week. EWMA, which weights the quiet recent days most, reads 28%. The ensemble sits at 38%. For the next 24 hours that gives an 80% range of $78.3k to $81.7k, about the box itself. For the next 7 days it is $75.1k to $85.2k.
Forecast issued 09:00 UTC on October 29, from a spot of $79,987. No direction is assumed: the median is the spot.
04Positioning
Perpetual funding averaged 0.0045% per 8 hours over the past week, below the 0.01% exchanges charge by default and below its own 30-day average of 0.0053%. Bybit’s rate is slightly negative. Leverage is light on both sides. That fits a quiet range, and it means there is no crowded side for a sharp move to squeeze.
05The call
Because this is a short-term read, this issue makes a 7-day call instead of the monthly 30-day one. The forecast’s 80% range for November 5 is $75,090 to $85,203, and its 95% range is $72,466 to $88,289. The November 5 close scores it, here and on the notes page. Since May, the 7-day ranges have landed inside the 80% band 87% of the time, a little more often than promised.
None of this is a trade signal. It describes where price sits and the range the models allow.
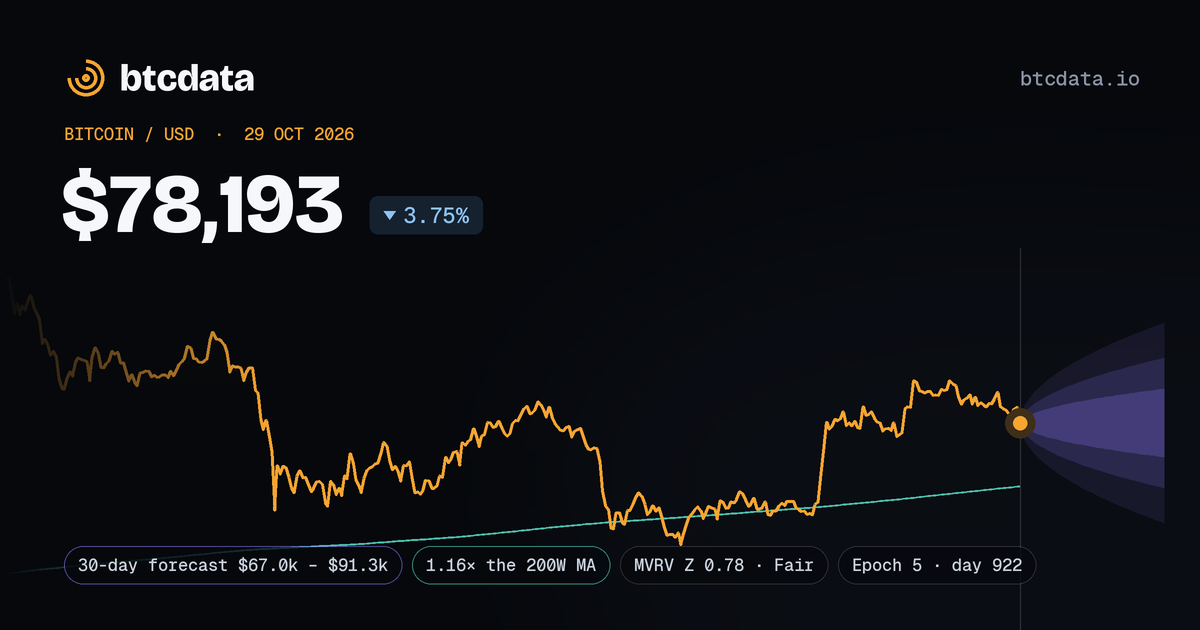
The forecast’s ranges at issue, stored with the note. The Thursday, November 5, 2026 close scores it in 7 days; the result shows here and on the notes page.
A reading of public data on the issue day, not a forecast of direction or investment advice.